Updated on April 26, 2022 On Sunday, the Boston Globe Magazine published its annual "Top Spots to Live in Greater Boston" feature, which I've been fortunate enough to write for…
Diverse communities in Massachusetts
Unlike its northern New England neighbors, Massachusetts is at least somewhat racially diverse: 68% White, 7% Black, 7% Asian, and 12% Latino, according to the 2020 Census. (The U.S. as a whole is 62%, 12%, 6%, and 19%, respectively.)
But a lot of our minority residents are clustered in Boston (which is actually a lot more diverse than people realize) and a few other cities, leaving some otherwise very charming suburbs feeling, to me, uncomfortably white.
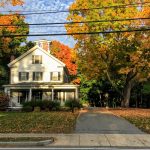
I mean, take Hingham, for example: It’s adorable. Eleanor Roosevelt called its Main Street the most beautiful in America. You can take a boat or a train to Boston and walk to a huge state park. Its playgrounds are shady and fun. But Hingham was, until recently, 99% white. (The new census puts that figure at an only slightly less disconcerting 92% white.) In a country with such a deep, painful history of racial oppression and inequity… that’s unsettling.
And the fact is, where you raise your kids has a lot to do with their understanding of race. As sociologist Margaret Hagerman writes in Time, “The choices parents make about how to set up children’s lives influence their kids’ ideas about race and racism. The neighborhood they live in, the school they attend and the activities they participate in — sports leagues, religious organization, clubs, summer camps — set the parameters for how kids understand race. And this is true whether parents are consciously aware that these choices matter or not, and regardless of what parents explicitly say about race.”
Hagerman’s research found that white kids who attended diverse schools and lived near Black or Latino neighborhoods were far more comfortable conveying complex ideas about racism than peers in predominantly white schools and neighborhoods, despite similarly well intentioned parents. Talking with your kids about racism is important, but not always enough.
Proximity is prologue
Obviously, just moving to or living in a diverse community is not going to end racism or shield your child from it. If anything, you and your kid may be forced to confront it more often. The old white townies who casually cast coded racist remarks about our immigrant neighbors have me in a perpetual state of outrage, and have forced us to have some difficult but necessary conversations with our young daughter about race and privilege in this country.
But proximity and real-life relationships matter. It’s so important that your kids learn to live, learn, socialize, and, crucially, empathize with kids from different backgrounds.
One of the best ways to inoculate kids against racial bias is to help them form positive cross-racial interactions and friendships. For example, one study found that adolescents who had cross-group friendships were less likely to develop biases against immigrants, even if their parents or peers were biased.
People who live in a racially diverse neighborhood are more likely to be kind and generous, too, according to multiple studies, one of which took place in the Boston area. And wealthy people who live in economically diverse ZIP codes give far more to charity than those who isolate themselves in wealthy enclaves.
The Boston Indicators Project recently compiled data on every school in Massachusetts to create a Diversity Index — which is based on the odds that two students chosen at random would be of different races. The three most diverse schools in Massachusetts are all elementary schools in Cambridge. And the most diverse high school in the state is Malden High, where the student body is 24% White, 22% Black, 28% Latino, and 24% Asian, and 3% Multiracial.
Why is that important? According to the Boston Indicators report:
“Attending integrated schools is associated with positive cognitive, attitudinal, behavioral and psychological outcomes that position all students to be more successful in the multicultural workplace of the 21st century… Students’ experiences in classrooms where they learn alongside peers from different backgrounds and with different perspectives tend to promote critical thinking and problem-solving skills as well as creativity and motivation. These experiences are also related to reduced racial and ethnic prejudice, lower likelihood of stereotyping others, increase in inter-racial friendships and trust, and greater cultural competency—all markers of an improved ability to navigate multicultural settings and to succeed in an increasingly diverse workplace and society.”
The point is, there’s a lot more to “good schools” than test scores, and creating a more just, equitable world starts in your own community. Sometimes, heart is where the home is.
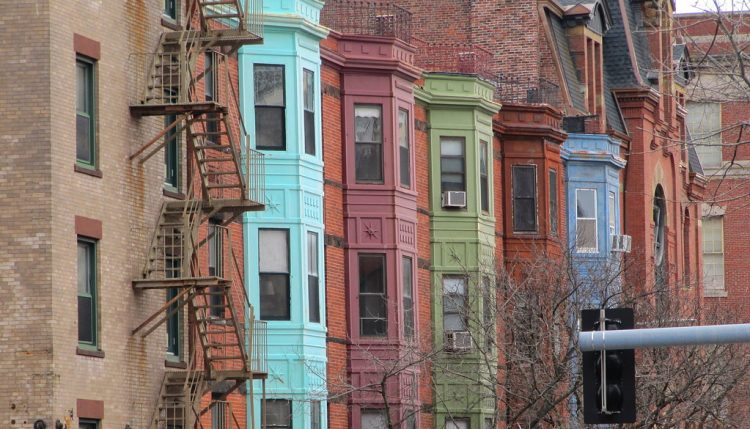
Racially diverse communities around Boston
To that end, here are some places in our Commonwealth that are at least as diverse as the state average — where white residents make up no more than 72% of the population, according to Census data. It’s not an exhaustive list, but it’s a good place to start.
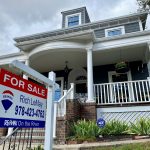
Not coincidentally, a number of these communities are among the most desirable or best values in the Boston area.
A ★ indicates a community that made my very subjective list of the Best Places to Live in and Around Boston. (Median home prices are courtesy of Redfin as of May 2020, and include both condos and single family homes.)
★ Cambridge
- Median home price: $856,000
- Racial makeup: 55% White | 10% Black | 19% Asian | 9% Hispanic | 5% Multiracial
★ Jamaica Plain, Boston
- Median home price: $648,000
- Racial makeup: 54% White | 11% Black | 7% Asian | 22% Hispanic | 6% Multi/Other
★ South End, Boston
- Median home price: $1,190,000
- Racial makeup: 57% White | 10% Black | 16% Asian | 13% Hispanic | 5% Multi/Other
Mission Hill, Boston
- Median home price: $599,000
- Racial makeup: 39% White | 14% Black | 24% Asian | 19% Hispanic | % Multi/Other
★ Malden
- Median home price: $526,000
- Racial makeup: 40% White | 14% Black | 26% Asian | 10% Hispanic | 7% Multiracial
Waltham
- Median home price: $596,000
- Racial makeup: 60% White | 7% Black | 12% Asian | 16% Hispanic | 3% Multiracial
★ Medford
- Median home price: $657,000
- Racial makeup: 67% White | 8% Black | 11% Asian | 6% Hispanic | 5% Multiracial
★ Lowell
- Median home price: $316,000
- Racial makeup: 41% White | 8% Black | 22% Asian | 22% Hispanic | 5% Multiracial
Somerville
- Median home price: $915,000
- Racial makeup: 65% White | 5% Black | 11% Asian | 11% Hispanic | 6% Multiracial
Worcester
- Median home price: $286,000
- Racial makeup: 49% White | 14% Black | 7% Asian | 25% Hispanic | 4% Multiracial
Randolph
- Median home price: $370,000
- Racial makeup: 27% White | 42% Black | 13% Asian | 11% Hispanic | 6% Multiracial
Roslindale, Boston
- Median home price: $528,000
- Racial makeup: 46% White | 21% Black | 3% Asian | 25% Hispanic | 5% Multi/Other
Framingham
- Median home price: $467,000
- Racial makeup: 54% White | 6% Black | 7% Asian | 17% Hispanic | 9% Multiracial
Allston, Boston
- Median home price: $540,000
- Racial makeup: 51% White | 5% Black | 25% Asian | 13% Hispanic | 6% Multi/Other
Brighton, Boston
- Median home price: $524,000
- Racial makeup: 63% White | 5% Black | 16% Asian | 10% Hispanic | 6% Multi/Other
Dorchester, Boston
- Median home price: $570,000
- Racial makeup: 22% White | 35% Black | 11% Asian | 21% Hispanic | 11% Multi/Other
Brockton
- Median home price: $330,000
- Racial makeup: 28% White | 34% Black | 2% Asian | 12% Hispanic | 17% Multiracial
Lynn
- Median home price: $407,000
- Racial makeup: 34% White | 11% Black | 7% Asian | 44% Hispanic | 3% Multiracial
★ Milton
- Median home price: $740,000
- Racial makeup: 71% White | 13% Black | 6% Asian | 5% Hispanic | 5% Multiracial
★ Quincy
- Median home price: $510,000
- Racial makeup: 54% White | 5% Black | 31% Asian | 5% Hispanic | 4% Multiracial
★ Brookline
- Median home price: $860,000
- Racial makeup: 65% White | 3% Black | 19% Asian | 7% Hispanic | 5% Multiracial
Everett
- Median home price: $505,000
- Racial makeup: 34% White | 14% Black | 8% Asian | 29% Hispanic | 9% Multiracial
Fitchburg
- Median home price: $255,000
- Racial makeup: 55% White | 6% Black | 4% Asian | 30% Hispanic | 5% Multiracial
Leominster
- Median home price: $274,000
- Racial makeup: 64% White | 6% Black | 3% Asian | 19% Hispanic | 5% Multiracial
Lexington
- Median home price: $1,270,000
- Racial makeup: 57% White | 1% Black | 33% Asian | 3% Hispanic | 5% Multiracial
Marlborough
- Median home price: $390,000
- Racial makeup: 59% White | 3% Black | 6% Asian | 16% Hispanic | 10% Multiracial
New Bedford
- Median home price: $268,000
- Racial makeup: 57% White | 5% Black | 1% Asian | 24% Hispanic | 9% Multiracial
Revere
- Median home price: $455,000
- Racial makeup: 45% White | 5% Black | 6% Asian | 37% Hispanic | 5% Multiracial
East Boston, Boston
- Median home price: $316,000
- Racial makeup: 37% White | 3% Black | 4% Asian | 50% Hispanic | 5% Multi/Other
★ Salem
- Median home price: $440,000
- Racial makeup: 69% White | 4% Black | 3% Asian | 20% Hispanic | 4% Multiracial
Honorable Mentions
These cities just outside Boston aren’t quite as diverse as the ones above, but they’re still less than three-quarters white, and offer charming homes in walkable, livable neighborhoods at two different price points.
★ Newton
- Median home price: $1,000,000
- Racial makeup: 70% White | 3% Black | 17% Asian | 5% Hispanic | 5% Multiracial
★ Norwood
- Median home price: $533,000
- Racial makeup: 73% White | 7% Black | 7% Asian | 7% Hispanic | 4% Multiracial
Related posts:

Jon Gorey • May 31, 2020